The Skinwalker Ranch 1.6 GHz Case Study
In order to investigate a particular frequency, or band of frequencies that have been received, one would need to carry out, a simplistic sequence of events and have a good understanding of electromagnetic behaviour and sources of interference before progressing, particularly the aspect of Radio Frequency (RF) and electromagnetic propagation.
Our investigatory course of action for any spurious frequency, would be to search for a frequency, identify the frequency and locate, if necessary, the location of the transmission.
Searching for a frequency – this can easily be carried out using a broadband scanner or receptor. As these are specialist devices and can get both complex and expensive, I would suggest the use of a software defined radio device (SDR) that can be used to manually scan and provide a visual depiction of transmissions over a given bandwidth. These can provide the capability, depending on the particular model, of receiving frequencies from 500 kHz up to 1.75 GHz (most cannot transmit).
I would suggest the user has basic knowledge of harmonics and how they are produced. Many of these SDR dongle devices and their related software should also depict the basic allocation of a given frequency (Military, Civilian Air etc).
Known sources
Known sources of transmission are well documented, for this reason we consult regional Frequency Allocation Tables (FAT's) and secondly international FAT's. The majority of countries in the world have governing spectrum allocation bodies that control all frequencies - In the UK they're controlled by OFCOM and in the U.S.A. the FCC (Federal Communications Commission). Internationally, most countries fall under the control umbrella of the International Telecommunication Union (ITU). All of these publish their respective FAT's. These tables list all authorised forms of transmission and modes.
Frequency deconfliction within the FAT's would be the initial and the most essential course of action to establish known sources of transmission. One must also consider the frequency profile and mode that the frequency is being received. These could come in the form of many, including, data, automatic link establishment/frequency hopping, non-comms radar etc. The list is extremely extensive. The possession of a frequency profile database comes in very handy to further eliminate and narrow down sources of propagation.
Factors that complicate probability of success
Beyond any spectrum deconfliction and signal analysis, consideration must also be given to many other factors, including:
- International, unintended, long range transmissions due to atmospheric conditions (ducting etc).
- Interference from the solar system and cosmos (the sun & stars).
- Foreign intelligence services transmissions that will not appear on any FAT, including jamming.
- Criminal or pirate activity and transmissions (unlicensed stations).
Illegal Activity – Monitoring/Bugs
Bugs & listening devices – Are either active or passive = active will require the listening device to onwardly transmit, which would require a power source and sufficient transmitting power to the intended recipient. A passive device would require simply a power source and storage device, but also requires physical interaction for retrieval. Therefore, if in a remote area, either the transmission power would have to be greater or the owner of the device would have to risk exposure upon retrieval.
Should one be concerned with locating the source of a transmission, steps would need to be taken to establish a position fix for the source. This requires at least 3 lines of bearing from different locations, using narrow-field, passive receptors (yagi antennas are sufficient for this task).
In this era of digitalisation, the easiest form of surveillance has to be the cell phone. Advances in technology now enables the eavesdropper to be able to target a user's cellphone with only the phone number in order to gain full access without permission!
Interference
We live in a condensed electromagnetic world, contaminated by frequencies and their subsequent effects (interference). A very complex aspect of reception, however, on a simplistic and immediate level, these can be categorised under certain aspects of causation. These include Man-made sources such as power lines, unshielded devices, motors etc) and natural sources, including atmospheric conditions, lightening, the stars above and even the sun.
Summary steps and courses of action
Search for the frequency using a scanning / searching device - (SDR Dongle & software (there are many (I use RTL-SDR & Airspy))).
Identify the frequency mode/type using a comparative database (Radio Signals Recognition database – I use Artemis)
Frequency FAT table look-up and deconfliction (consult the IEEE GRSS Database of Frequency Allocations)
Establish any type of Sources of Interference
Establishing a position fix of the source
Internet information searching, including the use of scanning websites
Should the above actions fail to satisfy the transmission in line with any FAT, one should consult and or report their findings to their respective communications controlling body (FCC/OfCom).
Case Study Example – The Skinwalker Ranch 1.6 GHz anomaly
Out of curiosity and after watching various episodes on TV, the interesting anomaly that keeps appearing on Skinwalker Ranch prompted me to do some initial investigation surrounding the 1.6 GHz frequency anomaly.
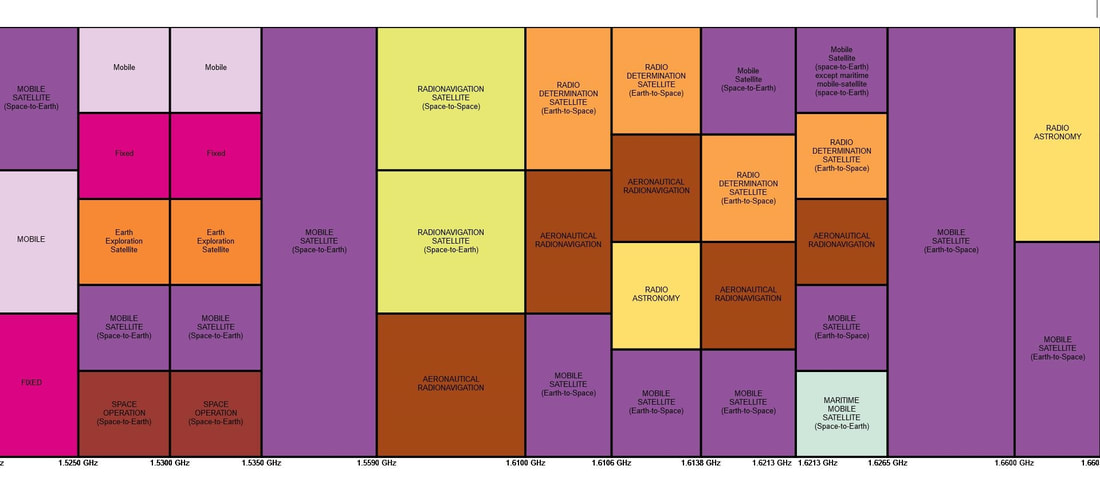
It soon becomes apparent that upon initial inspection of the FAT, that uses for frequencies in the region 1.6 GHz (1.5590 GHz – 1.6106 GHz) designated L BAND, are authorised for:
RADIONAVIGATION SATELLITE (Space-to-Space)
RADIONAVIGATION SATELLITE (Space-to-Earth)
AERONAUTICAL RADIONAVIGATION
Our investigatory course of action for any spurious frequency, would be to search for a frequency, identify the frequency and locate, if necessary, the location of the transmission.
Searching for a frequency – this can easily be carried out using a broadband scanner or receptor. As these are specialist devices and can get both complex and expensive, I would suggest the use of a software defined radio device (SDR) that can be used to manually scan and provide a visual depiction of transmissions over a given bandwidth. These can provide the capability, depending on the particular model, of receiving frequencies from 500 kHz up to 1.75 GHz (most cannot transmit).
I would suggest the user has basic knowledge of harmonics and how they are produced. Many of these SDR dongle devices and their related software should also depict the basic allocation of a given frequency (Military, Civilian Air etc).
Known sources
Known sources of transmission are well documented, for this reason we consult regional Frequency Allocation Tables (FAT's) and secondly international FAT's. The majority of countries in the world have governing spectrum allocation bodies that control all frequencies - In the UK they're controlled by OFCOM and in the U.S.A. the FCC (Federal Communications Commission). Internationally, most countries fall under the control umbrella of the International Telecommunication Union (ITU). All of these publish their respective FAT's. These tables list all authorised forms of transmission and modes.
Frequency deconfliction within the FAT's would be the initial and the most essential course of action to establish known sources of transmission. One must also consider the frequency profile and mode that the frequency is being received. These could come in the form of many, including, data, automatic link establishment/frequency hopping, non-comms radar etc. The list is extremely extensive. The possession of a frequency profile database comes in very handy to further eliminate and narrow down sources of propagation.
Factors that complicate probability of success
Beyond any spectrum deconfliction and signal analysis, consideration must also be given to many other factors, including:
- International, unintended, long range transmissions due to atmospheric conditions (ducting etc).
- Interference from the solar system and cosmos (the sun & stars).
- Foreign intelligence services transmissions that will not appear on any FAT, including jamming.
- Criminal or pirate activity and transmissions (unlicensed stations).
Illegal Activity – Monitoring/Bugs
Bugs & listening devices – Are either active or passive = active will require the listening device to onwardly transmit, which would require a power source and sufficient transmitting power to the intended recipient. A passive device would require simply a power source and storage device, but also requires physical interaction for retrieval. Therefore, if in a remote area, either the transmission power would have to be greater or the owner of the device would have to risk exposure upon retrieval.
Should one be concerned with locating the source of a transmission, steps would need to be taken to establish a position fix for the source. This requires at least 3 lines of bearing from different locations, using narrow-field, passive receptors (yagi antennas are sufficient for this task).
In this era of digitalisation, the easiest form of surveillance has to be the cell phone. Advances in technology now enables the eavesdropper to be able to target a user's cellphone with only the phone number in order to gain full access without permission!
Interference
We live in a condensed electromagnetic world, contaminated by frequencies and their subsequent effects (interference). A very complex aspect of reception, however, on a simplistic and immediate level, these can be categorised under certain aspects of causation. These include Man-made sources such as power lines, unshielded devices, motors etc) and natural sources, including atmospheric conditions, lightening, the stars above and even the sun.
Summary steps and courses of action
Search for the frequency using a scanning / searching device - (SDR Dongle & software (there are many (I use RTL-SDR & Airspy))).
Identify the frequency mode/type using a comparative database (Radio Signals Recognition database – I use Artemis)
Frequency FAT table look-up and deconfliction (consult the IEEE GRSS Database of Frequency Allocations)
Establish any type of Sources of Interference
Establishing a position fix of the source
Internet information searching, including the use of scanning websites
Should the above actions fail to satisfy the transmission in line with any FAT, one should consult and or report their findings to their respective communications controlling body (FCC/OfCom).
Case Study Example – The Skinwalker Ranch 1.6 GHz anomaly
Out of curiosity and after watching various episodes on TV, the interesting anomaly that keeps appearing on Skinwalker Ranch prompted me to do some initial investigation surrounding the 1.6 GHz frequency anomaly.
It soon becomes apparent that upon initial inspection of the FAT, that uses for frequencies in the region 1.6 GHz (1.5590 GHz – 1.6106 GHz) designated L BAND, are authorised for:
RADIONAVIGATION SATELLITE (Space-to-Space)
RADIONAVIGATION SATELLITE (Space-to-Earth)
AERONAUTICAL RADIONAVIGATION
This then prompts the question of contacting the relevant agencies responsible for those transmissions. However, due to the numerous agencies involved in satellite communications, this would almost be impossible to determine the actual transmission origin and something out of my scope of reach. The quantity of satellite capable transmitters, both ground based and airborne, within the visual horizon, is immense.
Likewise with the Aeronautical Radio-navigation aspect of transmissions, the number and scope of variation is out of reach to the general public.
What CAN be established, is the type of transmission profile emitted which can then be compared to a known source – sources of which are not extensive (low level, generic databases do exist – e.g. Artemis).
Regardless of these profiles, at Skinwalker Ranch, it appears that THE overriding factor of the unexplained reception is the sporadic nature of transmission, and it's reactivity/response with activity on the ranch.
After looking at the frequency in the 1.6 GHz range for my own reception (U.K.) - I found similar transmission and whilst using an RTL SDR, found that the following sampling modes made a difference for ME:
Nothing using Quadrature Sampling
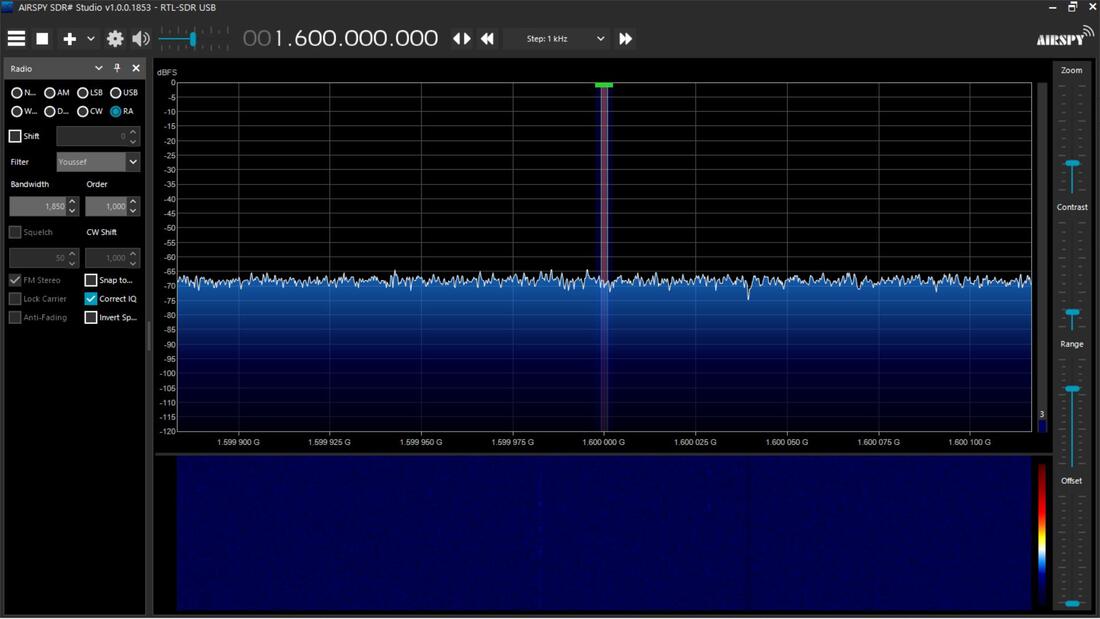
(below – using Q Branch sampling)
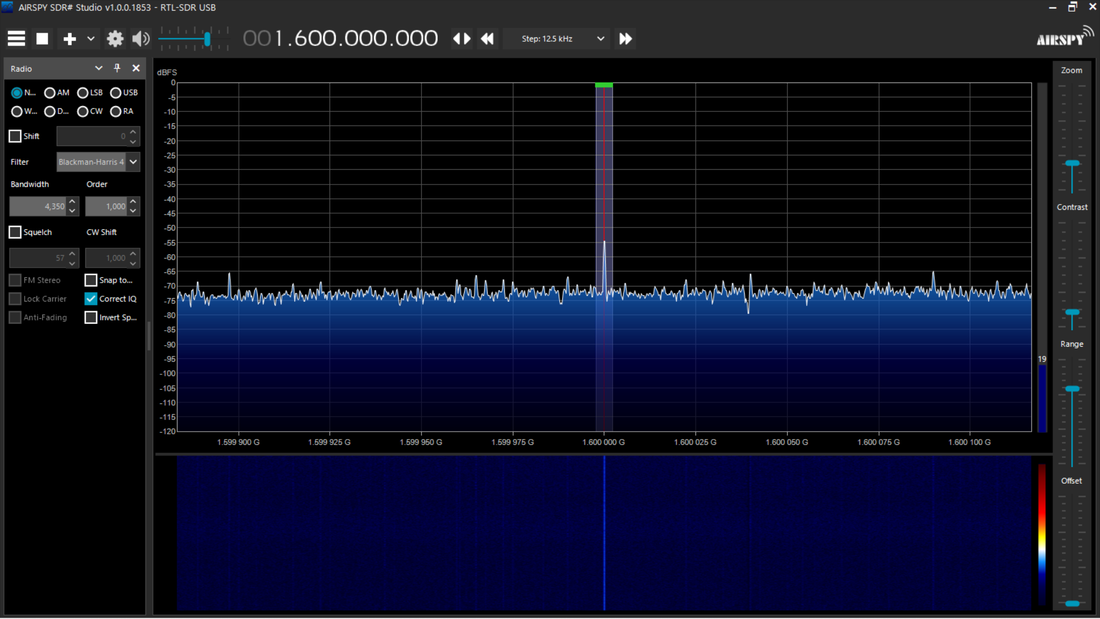
(below – using I branch sampling)
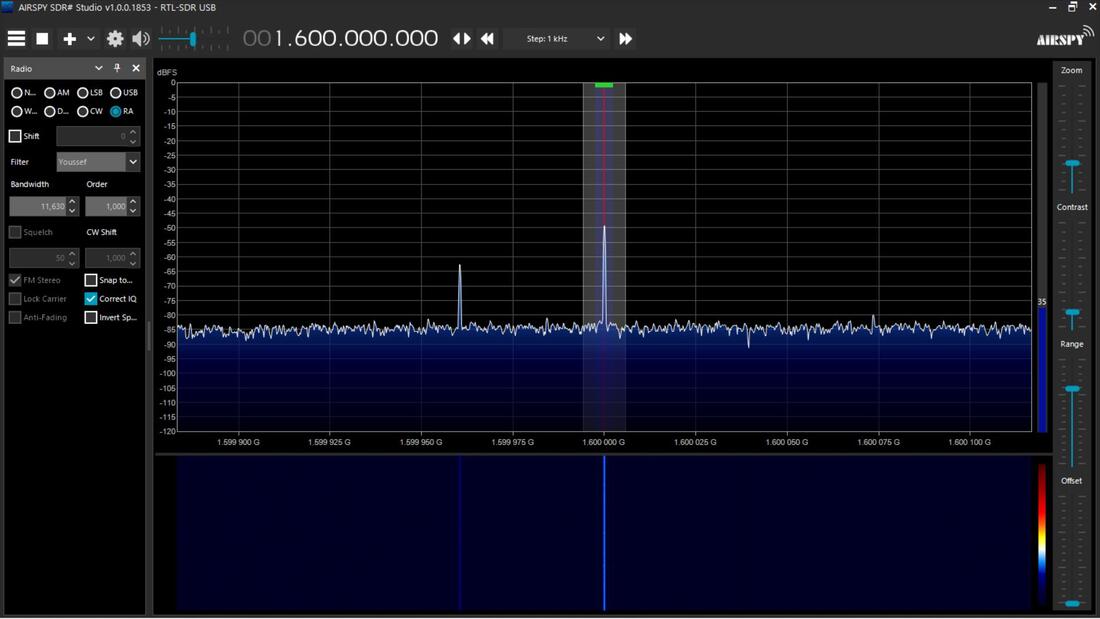
(below – using I branch sampling at 11am)
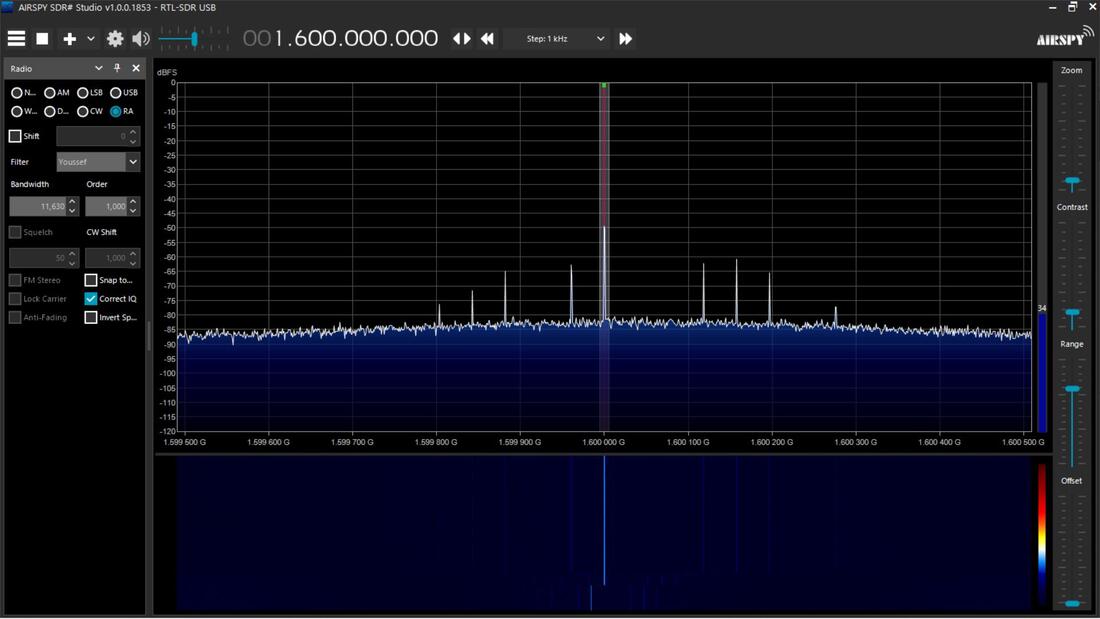
In 'Direct sampling (I branch) mode', using Airspy SDR# Studio v1.0.0.1853 – RTL-SDR USB, there are always some form of result. There is, ALWAYS a transmission spike being received, but can vary sporadically.
Below is a close up of the transmission profile.
Below is a close up of the transmission profile.
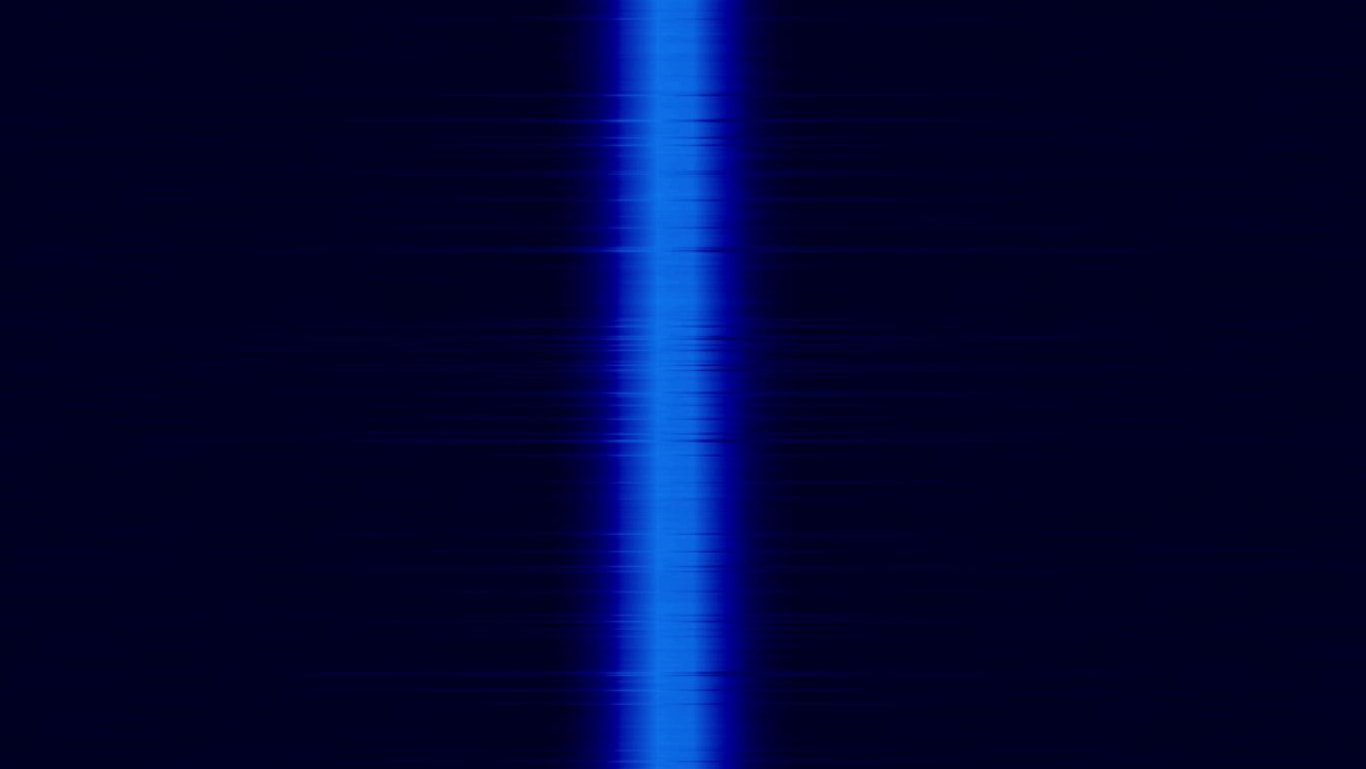
Something is clearly being received.
One could argue that the proximity to a satellite GPS Control Segment ground stations could be the culprit.
There are government tracking and uploading facilities distributed around the world. These facilities not only monitor the L-band signals from the GPS satellites and update their Navigation Messages, but also track the satellite’s health, their manoeuvrers, and many other things, even battery recharging. Taken together, these facilities are known as the Control Segment.
The nearest Satellite Ground Station (327 miles) is a Master Control Station (MCS), which is located at the Consolidated Space Operations Center (CSOC) at Schriever (formerly Falcon) Air Force Base near Colorado Springs, Colorado, and has been manned by the 2nd Space Operations Squadron (2SOPS), since 1992. There is an alternate MCS in at Vandenberg Tracking Station in California.
As stated, many systems use the L-Band and is a shared band internationally allocated to the radionavigation-satellite service (RNSS) in the space-to-earth and space-to-space directions. Global Navigation Satellite Systems (GNSS) is the standard generic term for radionavigation-satellite systems that provide autonomous geo-spatial positioning with global coverage
Summary
The initial stages of signal analysis is a straight forward task. To determine the actual causation of origin becomes difficult if the signal of interest cannot be cross-referenced with any Frequency Allocation Table and or identified/associated with a known source. One would have to determine time of reception/transmission/occurrence to add credence to the proposed solution. In the Skinwalker ranch case, it appears that an L-Band Satellite GPS signal is not the origin due to the sporadic interactivity of the transmission at the ranch.
The investigation and questions continue.
Author
Written by a team member of ARUK - Anomaly Researchers, UK.
 RSS Feed
